Get Natick and Metrowest Listings and Market Information

Work with Robb Enterprises real estate to buy, sell, or lease property that is right for you

  • Properties
    • For Rent
    • For Sale
    • Vacation Rental
    • Commercial
  • Specialty Properties
    • Natick New Construction
    • Natick Waterfront
    • Natick Apartments 01760
    • Section 8 Advertised Properties
  • Agents
  • Compare
  • Blog
  • Contact Us

November: Massachusetts Homes Remain Under Pressure: Sales Plummet While Prices Hit Records

December 19, 2023 by admin Leave a Comment

Massachusetts Homes Remain Under Pressure: Sales Plummet While Prices Hit Records

November Review: Massachusetts residential real estate saw dramatic shifts in November, with plummeting sales but record-high prices for both single-family homes and condos. The Warren Group, a leading data provider, reports that the market continues to be squeezed by limited inventory and elevated interest rates.

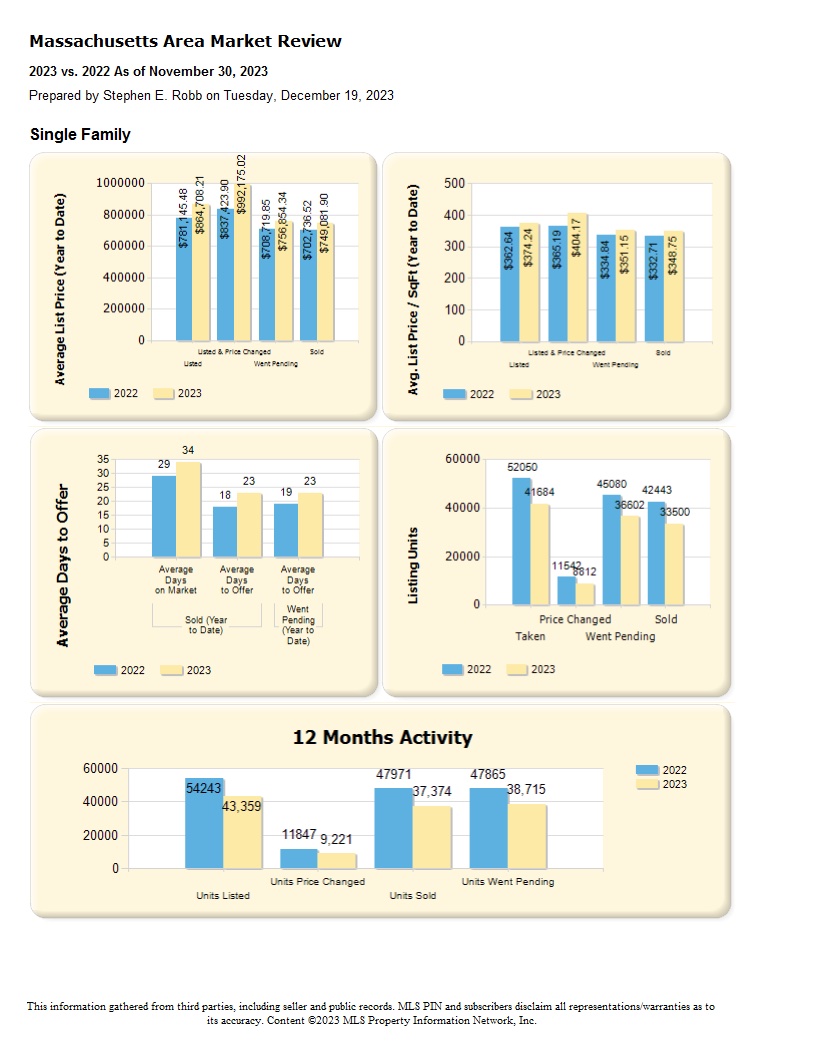
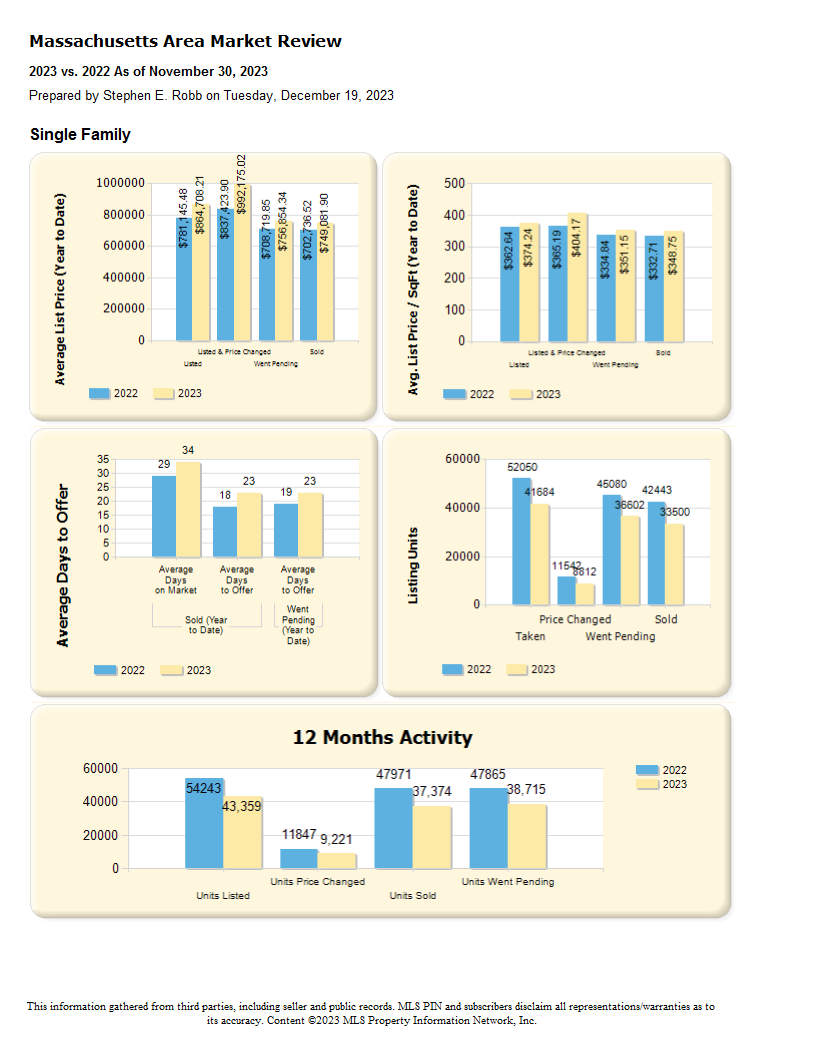
Single-Family Homes:

  • Sales dive: November saw a 10.6% year-over-year decline in single-family home sales, with only 3,447 transactions compared to 3,854 in 2022. This marks the lowest November sales figure since 2011.
  • Record-breaking prices: Despite the sales drop, the median single-family home price soared 8.4% to $579,900, a new high for the month. Year-to-date, prices have risen 4.0% to $572,000.
  • Limited inventory: Cassidy Norton, Associate Publisher at The Warren Group, attributes the price hike to “pent-up demand due to limited inventory.”
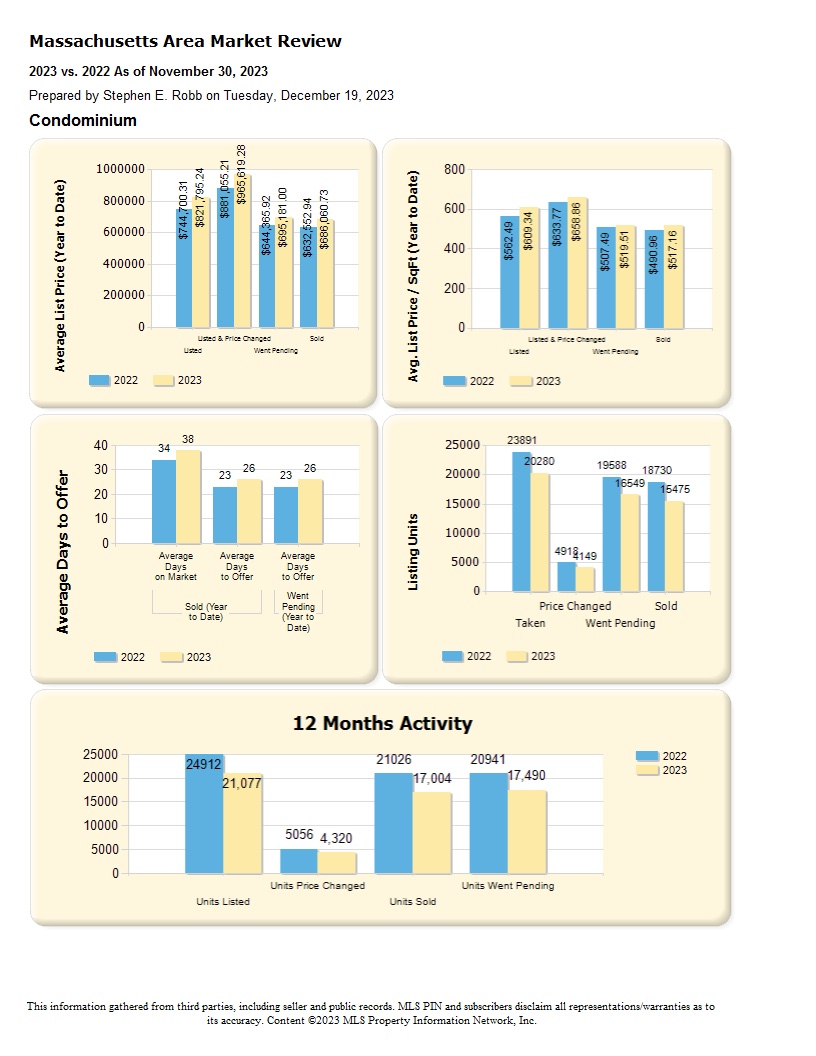
Condominiums:

  • Similar trends: Condos mirrored the single-family market, with sales falling 10.3% from 1,658 in November 2022 to 1,487 in 2023.
  • Price plateauing?: However, condo prices showed a glimmer of hope for buyers, remaining steady at $500,000 for the past three months. Year-to-date, the median price rose 4.7% to $512,900.

Greater Boston:

  • Sales slump: The Greater Boston market echoed the statewide trend, with single-family sales down 10.1% and condo sales down 10.7% year-over-year.
  • Price increases: Single-family prices in the region climbed 6.9% to $700,000, while condo prices remained flat at $550,000.

Future outlook:

  • Norton anticipates continued tightness in the market due to interest rates but predicts some relief in 2024 if the Federal Reserve lowers rates as planned.


Thinking of buying, selling, renting, or need landlord representation? Contact Us Today


Filed Under: Market Review, Real Estate Tagged With: analytics, data, Market Review, Statistics, The Warren Group

Massachusetts Single Family Market Insights ’23 Q2

August 1, 2023 by admin Leave a Comment

As the second quarter of the 2023 real estate market comes to a close, it is time to take a look at what transpired. Let’s take a look at some statistics and wrap it up without overcomplicating it. We will discuss interest rates in a different post, however, they are a key driver in what’s happening in the market.

  1. Over the past 5 years, the sales volume is down while the sales price is up. The days listed on market is up this year, but still in line with the past two years staying under a month.
  2. Inventory is way down this year which has driven up single family home prices.
  3. Weekly active listings confirm the overall inventory shortage.
  4. Hover over the black dots to see the Sale to List price ratio. This shows us that the limited inventory is still causing multiple offer scenarios pushing the sales price above the list price.
  5. Even though the sale prices are up, the total dollar volume is down due to the lack of inventory and less sales over the past couple of years.
  6. Same as before, less monthly listings results in less sales in comparison to last year.
  7. Similar to the previous slide, just expanded to see the data in a weekly format rather than monthly. You can also see that there is a very similar weekly purchase trend as last year, just that the volume is down.
  8. Days on market for sold listings is up from last year, but only by a week, still leaving homes on the market for under a month before ACCEPTING an offer and the property going under agreement (UAG).
  9. Days to offer is just that, how many days on the market before receiving an offer. The days to offer will be lower than the days on market since days will be added to the offer time before accepting the offer and the property going under agreement.
  10. This is a monthly breakdown of the first slide of sales volume.
  11. Change in sales volume by zip code. If you have a question about your specific town, send us a message or give us a call to discuss your market.
  12. Same interactive map as the previous slide, this one just shows the percent change in transactions year over year.


Feel free to give us a shout to discuss your market or real estate plans. We look forward to hearing from you. (508) 258-9589


Filed Under: Market Review, News, Real Estate Tagged With: analytics, data, Market Review, Massachusetts, Statistics

Recent Posts

  • Massachusetts: May 2024 Market Update
  • Home Buyer Blues in Massachusetts: Sales Plummet to 12 year low While Prices Hit Record Highs
  • November: Massachusetts Homes Remain Under Pressure: Sales Plummet While Prices Hit Records
  • Massachusetts Housing Market Sees Record-High Prices Despite Decreasing Sales
  • Massachusetts Single Family Market Insights ’23 Q3

Categories

  • Business
  • Market Review
  • News
  • Office Space Wanted
  • Real Estate
  • Reference
  • Sport
  • Uncategorized

Recent Comments

    Tags

    100 Innings of Baseball Advisory Committee ALS analytics Baseball Belmont MA Charity Columbus Day Condo Prices data Framingham Lou Gehrig Market Review Massachusetts Natick Office Space Philanthropy Recycling South Natick Dam Statistics The Warren Group Yawkey Baseball League

    Copyright © 2025